Process:
Program is an executable file on the hard disk.
Process is a program that is running in memory and on the CPU. In other words, a process is a program in action.
Daemon process: system process that is not associated with a terminal, typically started on system startup.
User process: if a user start a process while he is logged in to a terminal, this process is labeled a user process.
PID: every process has a unique process ID called PID,
Child process: each process can start an unlimited number of other processes called child process.
Parent process(PID): The process been started by an existing process called parent process.
The ps command
Type the following ps command to display all running process:
# ps aux | less
Where,
- -A: select all processes
- a: select all processes on a terminal, including those of other users
- x: select processes without controlling ttys
Task: see every process on the system
# ps -A

# ps -e
STAT Columns:
S: sleeping
SW: sleeping and waiting
R: running
Task: See every process except those running as root
# ps -U root -u root -N
Task: See process run by user vivek
# ps -u vivek
Task: top command
The top program provides a dynamic real-time view of a running system. Type the top at command prompt:
# top
The table of values with the following columns:
• PID: This is the ID of the process
• USER: This is the user that is the owner of the process
• PR: This is the priority of the process
• NI: This is the “NICE” value of the process
• VIRT: This is the virtual memory used by the process
• RES: This is the physical memory used for the process
• SHR: This is the shared memory of the process
• S: This indicates the status of the process: S=sleep, R=running, and Z=zombie (S)
• %CPU: This is the % of CPU used by this process
• %MEM: This is the % of RAM used by the process
• TIME+: This is the total time of activity of this process
• COMMAND: This is the name of the process
iostat
To view the statistics of the CPU and the input/output device’s utilization,use the following command:
$ iostat
Shows only CPU statistics: $ iostat –c
Shows only disk statistics: $ iostat –d
This only shows the status at a point, if you want to refresh it every 5 seconds and repeat 3 times:
instat 5 3
Display a tree of processes
Pstree shows running processes as a tree. The tree is rooted at either pid or init if pid is omitted. If a user name is specified, all process trees rooted at processes owned by that user are shown.
$ pstree
htop and atop
htop is interactive process viewer just like top, but allows to scroll the list vertically and horizontally to see all processes and their full command lines. Tasks related to processes (killing, renicing) can be done without entering their PIDs. To install htop type command:
# apt-get install htop
or (fedora)
# yum install htop
Killing Processes
Kill
kill has 64 different kill signals, top five most popular ones are:
- 1, sighup : hang-up signal, it stops a process, then restarts it with the same PID. If you edit the configuration file used by a running daemon,that daemon might be sent a SIGHUP to restart the process; when the daemon starts again,it reads the new configuration file.
- 2, SIGINT: interrupt signal to a process. Although this signal is one of the weakest kill signals, it works most of the time. It equivalent to the Ctrl+c key combo.
- 3, SIGQUIT: Also known as a core dump, the quit signal terminates a process by taking the process information in memory and saving it to a file called core on the hard disk in the current working directory. You can use the Ctrl+\ key combination to send a SIGQUIT.
- 15, SIGTERM : The software termination signal is the most common kill signal used by programs to kill other processes. It is the default kill signal used by the kill command.
- 9, SIGKILL: Also known as the absolute kill signal, it forces the Linux kernel to stop executing the process by sending the process’s resources to a special device file called /dev/null.
syntax: kill -signal pid
Killall
Works similar to the kill command, it uses the process name to kill instead of the PID. This allows multiple processes of the same name to be killed in one command.
Running processes in the background
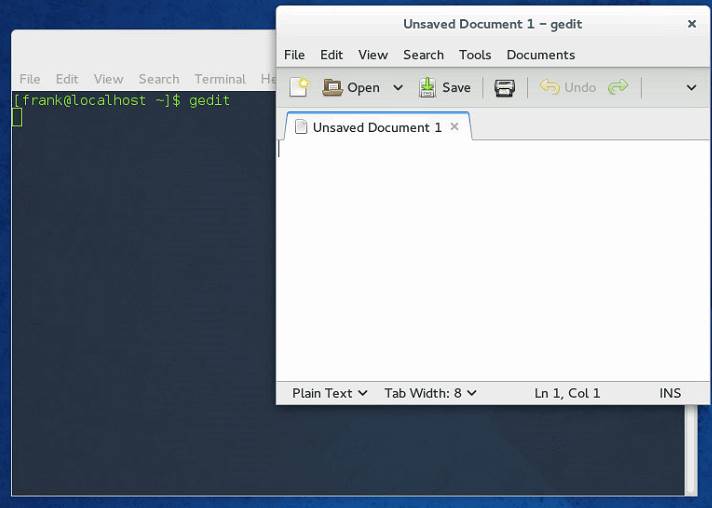
Foreground processes: original BASH shell must wait for the command in the subshell to finish before displaying a shell prompt to accept new commands. If you enter a program name, it will run in foreground by default. eg. # gedit
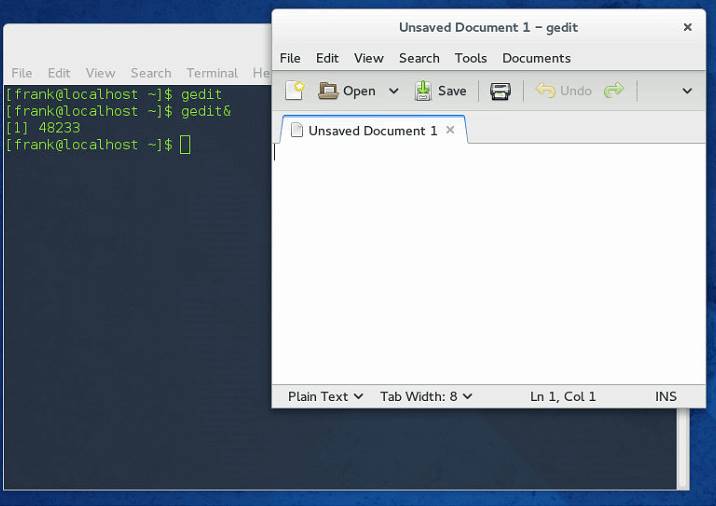
Background processes: original BASH shell immediately returns a shell prompt to accept new commands before must the command in the subshell to finish. To run a program in background, append an ampersand character (&). eg. # gedit& , and the shell will tell the PID
Process priorities
Use ps -l command to view the priority in the CPU.
PRI range from 0 to 127, 0 is highest priority and the 127 is lowest.
You can not change the PRI directly, but you can influence it indirectly by assigning a certain nice value to a process.
Nice value range from -20 to +19, default value is 0, minus value means the process most likely to receive time slices from the CPU, higher priority, positive value on the country.
1. Start a process with a nice value:
nice -n value process_name
2. Change the nice value for a process which is running:
renice value PID- Use top command, then press r key, then supply the PID and nice value when prompted.
3. change the nice value for all the processes owned by a user or group
renice value -u user_name
renice value -g group_name
check disk I/O utilisation per process
Sometimes, we need to check which process is causing high disk activity, we can use pidstat -dl 10 to monitor is every 10 seconds
pidstat -dl 10
Example: MRTG disk is 100% active time, this may cause the disk failure due to high load.
1, By using pidstat -dl 5 I found the sendmail is keeping on working.
2. Stop sendmail. sudo service sendmail stop
Find the old message in /var/spool/mqueue
ls -l /var/spool/mqueue
there are 6000 mails there….
So I first delete all the pending emails.
3. Then check the root email: sudo vi /var/mail/root and found this error:
2017-09-06 11:00:01: ERROR: It looks as if you are running two copies of mrtg in parallel on the same config file. There is a lockfile (/home/administrator/mrtg.cfg_l) and it is is only 0 seconds old ... Check your crontab.
 (/etc/crontab and /var/spool/cron/root)
Then I found this is due to a wrong configured cron job, after fixing that cron job, the disk activity back to normal.
Scheduling commands
at command
After type at absolute time
or at now + relative time
Location: /var/spool/at directory on Fedoras.
/var/spool/cron/atjobs on ubuntu.
Display the scheduled jobs: atq or at -l
• To remove a specific job listed by the atq command, we can use the following command:
$ atrm job-id
Cron tables
On a newly installed Fedora system, all users have the ability to schedule tasks using the cron daemon because the /etc/cron.deny file has no contents.
However, if you create an /etc/cron.allow file and add a list of users to it, only those users will be able to schedule tasks using the cron daemon.
To create or edit a user cron table, you can use command crontab -e, which opens the vi editor.
The format is :
# Example of job definition:
# .———— minute (0 – 59)
# | .———- hour (0 – 23)
# | | .——– day of month (1 – 31)
# | | | .—— month (1 – 12) OR jan,feb,mar,apr …
# | | | | .—- day of week (0 – 6) (Sunday=0 or 7) OR
# | | | | | sun,mon,tue,wed,thu,fri,sat
# | | | | |
# * * * * * command to be executed
E.g. To schedule /bin/command1 to run at 4:30 AM every Friday and /bin/command2 to run at 2:00 PM on the first day of every month, you can add the following lines
while in the vi editor:
30 4 * * 5 /bin/command1
0 14 1 * * /bin/command2
~
When the user saves the changes and quits the vi editor, the information is stored in the file /var/spool/cron/username, where username is the name of the user who executed the crontab –e command. In the preceding example, the file would be named /var/spool/cron/root.
To list your user cron table, you can use the –l option to the crontab command.
To remove a cron table and all scheduled jobs, you can use the –r option to the crontab command.
System Cron Tables
Linux systems are typically scheduled to run many commands during non-business hours. These commands might perform system maintenance, back up data, or run CPU-intensive programs. Most of these commands are scheduled by the cron daemon from entries in the system cron table /etc/crontab, which can only be edited by the root user.
The default /etc/crontab file on a Fedora system is shown in the following output:
[root@server1 ~]# cat /etc/crontab
SHELL=/bin/bash
PATH=/sbin:/bin:/usr/sbin:/usr/bin
MAILTO=root
# For details see man 4 crontabs
# Example of job definition:
# .------------ minute (0 - 59)
# | .---------- hour (0 - 23)
# | | .-------- day of month (1 - 31)
# | | | .------ month (1 - 12) OR jan,feb,mar,apr ...
# | | | | .---- day of week (0 - 6) (Sunday=0 or 7) OR
# | | | | | sun,mon,tue,wed,thu,fri,sat
# | | | | |
# * * * * * command to be executed
[root@server1 ~]# _
The initial section of the cron table specifies the environment used while executing commands. The remainder of the file contains comments that identify the format of a cron table entry. If you add your own cron table entries to the bottom of this file, they will be executed as the root user. Alternatively, you may prefix the command within a system cron table entry with the user account that it should be executed as.
For example, if the sysstat package is installed on your system, the sa1 command is run every 10 minutes as the root user by the cron daemon from the file /etc/cron.d/sysstat, as shown next:
[root@server1 ~]# cat /etc/cron.d/sysstat
# Run system activity accounting tool every 10 minutes
*/10 * * * * root /usr/lib/sa/sa1 -S DISK 1 1
# Generate a daily summary of process accounting at 23:53
53 23 * * * root /usr/lib/sa/sa2 -A
[root@server1 ~]# _
Notice in the preceding output that the second uncommented line (the sa2 command) runs at 11:53 PM as the root user.
Many administrative tasks are performed on an hourly, daily, weekly, or monthy basis. If you have a task of this type, you don’t need to create a system cron table. Instead, you can place a shell script that runs the appropriate commands in one of the following directories:
• Scripts that should be executed hourly in the /etc/cron.hourly/ directory
• Scripts that should be executed daily in the /etc/cron.daily/ directory
• Scripts that should be executed weekly in the /etc/cron.weekly/ directory
• Scripts that should be executed monthly in the /etc/cron.monthly/ directory
We can add macros in the crontab le. Use the following to restart my_program after each reboot:
@reboot /bin/my_program
@reboot echo `hostname` was rebooted at `date` | mail -s “Reboot
notification” [email protected]
The following is the summary of a few more macros:
| Entry | Description | Equivalent to |
| @reboot | Run once at startup | None |
| @weekly | Run once a week | 0 0 **0 |
| @daily | Run once a day | 0 0 *** |
| @midnight | (same as @daily) | 0 0 *** |
| @hourly | Run once an hour | 0 **** |
Notice that if you issued sudo crontab -e to schedule a script, then you need to change the script password bypass.
E.g, if you use command sudo crontab -e and then added below entry:
-
*/5 * * * * sudo sh /etc/mrtg/mrtgRefresh.sh
Then we need to configure password bypass for this script.
sudo visudoAdded the following line to the end of the file:
administrator ALL=NOPASSWD: /home/administrator/mrtgRefresh.sh
Crontab Log: /var/log/cron
Memory
Free command
DESCRIPTION
Free displays the total amount of free and used physical and swap memory in the system, as well as the buffers and caches used by the kernel. The information is gathered by parsing /proc/meminfo. The displayed columns are:
total: Total installed memory (MemTotal and SwapTotal in /proc/meminfo)
used: Used memory (calculated as total – free – buffers – cache)
free: Unused memory (MemFree and SwapFree in /proc/meminfo)
shared : Memory used (mostly) by tmpfs (Shmem in /proc/meminfo, available on kernels 2.6.32, displayed as zero if not available)
buffers: Memory used by kernel buffers (Buffers in /proc/meminfo)
cache: Memory used by the page cache and slabs (Cached and Slab in/proc/meminfo)
buff/cache: Sum of buffers and cache
available: Estimation of how much memory is available for starting new applications, without swapping. Unlike the data provided by the cache or free fields, this field takes into account page cache
and also that not all reclaimable memory slabs will be reclaimed due to items being in use (MemAvailable in /proc/meminfo, available on kernels 3.14, emulated on kernels 2.6.27+, otherwise the
same as free)
Options:
-b, –bytes show output in bytes
-k, –kilo show output in kilobytes
-m, –mega show output in megabytes
-g, –giga show output in gigabytes
–tera show output in terabytes
-h, –human show human-readable output
–si use powers of 1000 not 1024
-l, –lohi show detailed low and high memory statistics
-t, –total show total for RAM + swap
-s N, –seconds N repeat printing every N seconds
-c N, –count N repeat printing N times, then exit
lsof -i:8080 show which process is using port 8080