Network documentation
To monitor and troubleshoot a network, network administrators must have a complete set of accurate and current network documentation. This documentation includes:
- Configuration files, including network configuration files and end-system configuration files
- Network configuration files contain accurate, up-to-date records of the hardware and software used in a network. Within the network configuration files a table should exist for each network device used on the network, containing all relevant information about that device.
- Information that could be captured within a device table includes:
- Type of device, model designation
- IOS image name
- Device network hostname
- Location of the device (building, floor, room, rack, panel)
- If it is a modular device, include all module types and in which module slot they are located
- Data link layer addresses
- Network layer addresses
- Any additional important information about physical aspects of the device
- Information that could be captured within a device table includes:
- End-system configuration files
End-system configuration files focus on the hardware and software used in end-system devices, such as servers, network management consoles, and user workstations. An incorrectly configured end system can have a negative impact on the overall performance of a network. For this reason, having a sample baseline record of the hardware and software used on devices, and recorded in end-system documentation can be very useful when troubleshooting.
- Network configuration files contain accurate, up-to-date records of the hardware and software used in a network. Within the network configuration files a table should exist for each network device used on the network, containing all relevant information about that device.
- Physical and logical topology diagrams
- A baseline performance level: A baseline is used to establish normal network or system performance. Establishing a network performance baseline requires collecting performance data from the ports and devices that are essential to network operation.
Establishing a Network Baseline
To plan the first baseline, perform the following steps:
Step 1. Determine what types of data to collect.
When conducting the initial baseline, start by selecting a few variables that represent the defined policies. If too many data points are selected, the amount of data can be overwhelming, making analysis of the collected data difficult. Start out simply and fine-tune along the way. Some good starting measures are interface utilization and CPU utilization. (Cisco Wide Area Application Services (WAAS) software)
Step 2. Identify devices and ports of interest.
Use the network topology to identify those devices and ports for which performance data should be measured. Devices and ports of interest include:
- Network device ports that connect to other network devices
- Servers
- Key users
- Anything else considered critical to operations
A logical network topology diagram can be useful in identifying key devices and ports to monitor. For example, in Figure bellow the network administrator has highlighted the devices and ports of interest to monitor during the baseline test. The devices of interest include PC1 (the Admin terminal), and SRV1 (the Web/TFTP server). The ports of interest include those ports on R1, R2, and R3 that connect to the other routers or to switches, and on R2, the port that connects to SRV1 (G0/0).
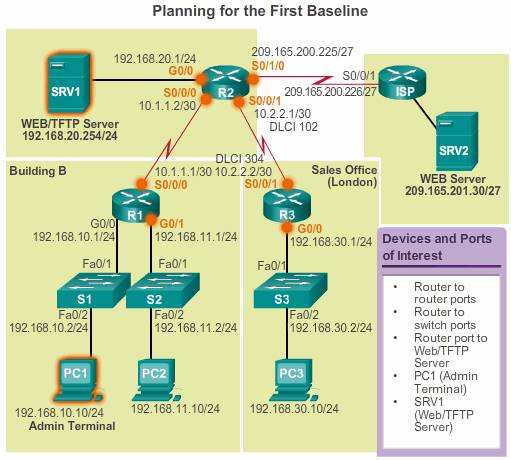
By shortening the list of ports that are polled, the results are concise, and the network management load is minimized. Remember that an interface on a router or switch can be a virtual interface, such as a switch virtual interface (SVI).
Step 3. Determine the baseline duration.
The length of time and the baseline information being gathered must be sufficient for establishing a typical picture of the network.
- It is important that daily trends of network traffic are monitored.
- It is also important to monitor for trends that occur over a longer period of time, such as weekly or monthly. For this reason, when capturing data for analysis, the period specified should be, at a minimum, seven days long.
Typically, a baseline needs to last no more than six weeks, unless specific long-term trends need to be measured. Generally, a two-to-four-week baseline is adequate.
Baseline measurements should not be performed during times of unique traffic patterns, because the data would provide an inaccurate picture of normal network operations. Baseline analysis of the network should be conducted on a regular basis. Perform an annual analysis of the entire network or baseline different sections of the network on a rotating basis. Analysis must be conducted regularly to understand how the network is affected by growth and other changes.
Measure data
Useful command for network documentation:
- Ping
- Traceroute
- telnet
- show ip interface brief (show ipv6 interface brief)
- show interface
- show ip route( show ipv6 route)
- show cdp neighbor detail
- show arp
- show running-config
- show port
- show vlan
- show tech-support
- show ip cache flow
Troubleshooting with a systematic approach
Stage 1. Gather symptoms
There are five steps to gathering information:
Step 1. Gather information – Gather information from the trouble ticket, users, or end systems affected by the problem to form a definition of the problem.
Step 2. Determine ownership – If the problem is within the control of the organization, move onto the next stage. If the problem is outside the boundary of the organization’s control (for example, lost Internet connectivity outside of the autonomous system), contact an administrator for the external system before gathering additional network symptoms.
Step 3. Narrow the scope – Determine if the problem is at the core, distribution, or access layer of the network. At the identified layer, analyze the existing symptoms and use your knowledge of the network topology to determine which piece of equipment is the most likely cause.
Step 4. Gather symptoms from suspect devices – Using a layered troubleshooting approach, gather hardware and software symptoms from the suspect devices. Start with the most likely possibility and use knowledge and experience to determine if the problem is more likely a hardware or software configuration problem.
Step 5. Document symptoms – Sometimes the problem can be solved using the documented symptoms. If not, begin the isolating stage of the general troubleshooting process.
Stage 2. Isolate the problem
Stage 3. Implement corrective action

Note: Although the debug command is an important tool for gathering symptoms, it generates a large amount of console message traffic and the performance of a network device can be noticeably affected. If the debug must be performed during normal working hours, warn network users that a troubleshooting effort is underway and that network performance may be affected. Remember to disable debugging when you are done.
Question end users

Isolating the issue using layered models
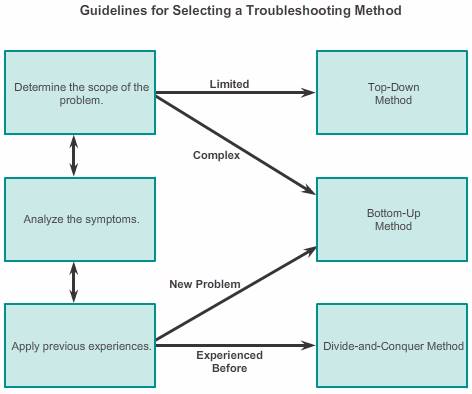
Using the layered models, there are three primary methods for troubleshooting networks:
- Bottom-up:
In bottom-up troubleshooting, you start with the physical components of the network and move up through the layers of the OSI model until the cause of the problem is identified.
Bottom-up troubleshooting is a good approach to use when the problem is suspected to be a physical one. Most networking problems reside at the lower levels, so implementing the bottom-up approach is often effective.
The disadvantage with the bottom-up troubleshooting approach is it requires that you check every device and interface on the network until the possible cause of the problem is found. Remember that each conclusion and possibility must be documented so there can be a lot of paper work associated with this approach. A further challenge is to determine which devices to start examining first.
- Top-down:
Top-down troubleshooting starts with the end-user applications and moves down through the layers of the OSI model until the cause of the problem has been identified. End-user applications of an end system are tested before tackling the more specific networking pieces.
Use this approach for simpler problems, or when you think the problem is with a piece of software.The disadvantage with the top-down approach is it requires checking every network application until the possible cause of the problem is found. Each conclusion and possibility must be documented. The challenge is to determine which application to start examining first.
- Divide-and-conquer:
The network administrator selects a layer and tests in both directions from that layer.In divide-and-conquer troubleshooting, you start by collecting user experiences of the problem, document the symptoms and then, using that information, make an informed guess as to which OSI layer to start your investigation.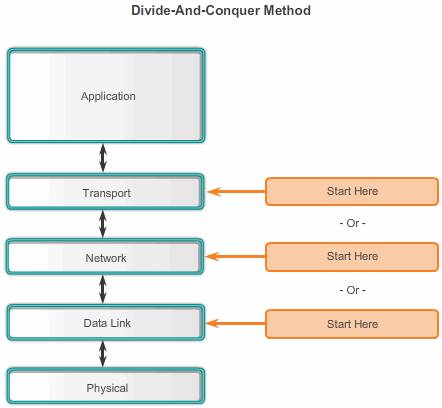
less-structured troubleshooting approaches
1, Shoot from the Hip
One troubleshooting approach is based on an educated guess by the network administrator, based on the symptoms of the problem. This method is more successfully implemented by seasoned network administrators, because seasoned network administrators rely on their extensive knowledge and experience to decisively isolate and solve network issues.
With a less-experienced network administrator, this troubleshooting method may be more like random troubleshooting.
2, Spot the different
Another approach involves comparing a working and non-working situation, and spotting significant differences, including:
- Configurations
- Software versions
- Hardware and other device properties
Using this method may lead to a working solution, but without clearly revealing the cause of the problem. This method can be helpful when the network administrator is lacking an area of expertise, or when the problem needs to be resolved quickly. After the fix has been implemented, the network administrator can do further research on the actual cause of the problem.
3, Substitution is another quick troubleshooting methodology. It involves swapping the problematic device with a known, working one. If the problem is fixed, that the network administrator knows the problem is with the removed device. If the problem remains, then the cause may be elsewhere.
Network Troubleshooting
Software troubleshooting
Network Management System Tools
Network management system (NMS) tools include device-level monitoring, configuration, and fault-management tools. Example “WhatsUp Gold” NMS software. These tools can be used to investigate and correct network problems. Network monitoring software graphically displays a physical view of network devices, allowing network managers to monitor remote devices without actually physically checking them.
Device management software provides dynamic status, statistics, and configuration information for switched products. Examples of other commonly used network management tools are CiscoView, HPBTO Software (formerly OpenView), and SolarWinds.
Knowledge Bases
On-line network device vendor knowledge bases have become indispensable sources of information. When vendor-based knowledge bases are combined with Internet search engines like Google, a network administrator has access to a vast pool of experience-based information.
Eg. Cisco Tools & Resources. This is a free tool providing information on Cisco-related hardware and software. It contains troubleshooting procedures, implementation guides, and original white papers on most aspects of networking technology.
Baselining Tools
Many tools for automating the network documentation and baselining process are available. These tools are available for Windows, Linux, and AUX operating systems. Figure 3 shows a screen capture of the SolarWinds LANsurveyor and CyberGauge software. Baselining tools help with common documentation tasks. For example, they can draw network diagrams, help keep network software and hardware documentation up-to-date, and help to cost-effectively measure baseline network bandwidth use.
Host-Based Protocol Analyzers
A protocol analyzer decodes the various protocol layers in a recorded frame and presents this information in a relatively easy to use format. The information displayed by a protocol analyzer includes the physical, data link, protocol, and descriptions for each frame. Most protocol analyzers can filter traffic that meets certain criteria so that, for example, all traffic to and from a particular device can be captured.
Particularly useful to capture end or source device traffic. Protocol analyzers such as Wireshark can help troubleshoot network performance problems.
Cisco IOS Embedded Packet Capture
The Cisco IOS Embedded Packet Capture (EPC) delivers a powerful troubleshooting and tracing tool. The feature allows for network administrators to capture IPv4 and IPv6 packets flowing through, to, and from, a Cisco router. The Cisco IOS EPC function is mainly used in troubleshooting scenarios where it is helpful to see the actual data being sent through, from, or to the network device.
The Cisco IOS EPC is useful whenever a network protocol analyzer might be useful in debugging a problem, but when it is not practical to install such a device.
Common hardware troubleshooting tools:
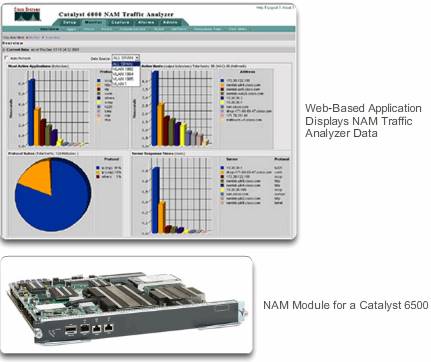
- Network Analysis Module – As shown in Figure, a network analysis module (NAM) can be installed in Cisco Catalyst 6500 series switches and Cisco 7600 series routers. NAMs provide a graphical representation of traffic from local and remote switches and routers. The NAM is an embedded browser-based interface that generates reports on the traffic that consumes critical network resources. In addition, the NAM can capture and decode packets and track response times to pinpoint an application problem to the network or the server.
- Digital Multimeters – Digital multimeters (DMMs), such as the Fluke 179 shown in Figure bellow, are test instruments that are used to directly measure electrical values of voltage, current, and resistance. In network troubleshooting, most of the multimedia tests involve checking power-supply voltage levels and verifying that network devices are receiving power.

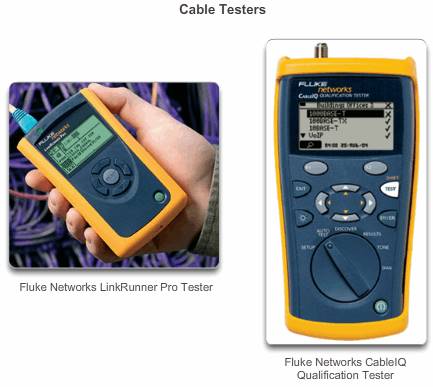
- Cable Testers – Cable testers are specialized, handheld devices designed for testing the various types of data communication cabling. Figure bellow shows two different Fluke cable testers. Cabling testers can be used to detect broken wires, crossed-over wiring, shorted connections, and improperly paired connections. These devices can be inexpensive continuity testers, moderately priced data cabling testers, or expensive time-domain reflectometers (TDRs). TDRs are used to pinpoint the distance to a break in a cable. These devices send signals along the cable and wait for them to be reflected. The time between sending the signal and receiving it back is converted into a distance measurement. The TDR function is normally packaged with data cabling testers. TDRs used to test fiber optic cables are known as optical time-domain reflectometers (OTDRs).
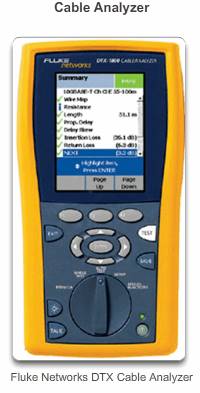
- Cable Analyzers – Cable analyzers, such as the Fluke DTX Cable Analyzer in Figure bellow, are multifunctional handheld devices that are used to test and certify copper and fiber cables for different services and standards. The more sophisticated tools include advanced troubleshooting diagnostics that measure distance to performance defect (NEXT, RL), identify corrective actions, and graphically display crosstalk and impedance behavior. Cable analyzers also typically include PC-based software. After field data is collected, the handheld device can upload its data to create up-to-date reports.
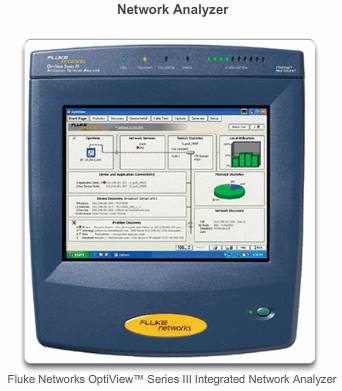
- Portable Network Analyzers – Portable devices like the Fluke OptiView in Figure above are used for troubleshooting switched networks and VLANs. By plugging the network analyzer in anywhere on the network, a network engineer can see the switch port to which the device is connected, and the average and peak utilization. The analyzer can also be used to discover VLAN configuration, identify top network talkers, analyze network traffic, and view interface details. The device can typically output to a PC that has network monitoring software installed for further analysis and troubleshooting.
Syslog server
Cisco devices can log information regarding configuration changes, ACL violations, interface status, and many other types of events. Cisco devices can send log messages to several different facilities. Event messages can be sent to one or more of the following:
- Console – Console logging is on by default. Messages log to the console and can be viewed when modifying or testing the router or switch using terminal emulation software while connected to the console port of the router.
- Terminal lines – Enabled EXEC sessions can be configured to receive log messages on any terminal lines. Similar to console logging, this type of logging is not stored by the router and, therefore, is only valuable to the user on that line.
- Buffered logging – Buffered logging is a little more useful as a troubleshooting tool because log messages are stored in memory for a time. However, log messages are cleared when the device is rebooted.
- SNMP traps – Certain thresholds can be preconfigured on routers and other devices. Router events, such as exceeding a threshold, can be processed by the router and forwarded as SNMP traps to an external SNMP server. SNMP traps are a viable security logging facility, but require the configuration and maintenance of an SNMP system.
- Syslog – Cisco routers and switches can be configured to forward log messages to an external syslog service. This service can reside on any number of servers or workstations, including Microsoft Windows and Linux-based systems. Syslog is the most popular message logging facility, because it provides long-term log storage capabilities and a central location for all router messages.
Cisco IOS log messages fall into one of eight levels,check it here. The lower the level number, the higher the severity level. By default, all messages from level 0 to 7 are logged to the console. While the ability to view logs on a central syslog server is helpful in troubleshooting, sifting through a large amount of data can be an overwhelming task.
The logging trap level command limits messages logged to the syslog server based on severity. The level is the name or number of the severity level. Only messages equal to or numerically lower than the specified level are logged.
R1(config)#logging host 192.168.0.1
R1(config)#logging trap notification
R1(config)#logging on
Symptoms and Causes of Network Troubleshooting
Physical layer
The physical layer transmits bits from one computer to another and regulates the transmission of a stream of bits over the physical medium. The physical layer is the only layer with physically tangible properties, such as wires, cards, and antennas.
Issues on a network often present as performance problems. Performance problems mean that there is a difference between the expected behavior and the observed behavior, and the system is not functioning as could be reasonably expected. Failures and suboptimal conditions at the physical layer not only inconvenience users but can impact the productivity of the entire company. Networks that experience these kinds of conditions usually shut down. Because the upper layers of the OSI model depend on the physical layer to function, a network administrator must have the ability to effectively isolate and correct problems at this layer.
Common symptoms of network problems at the physical layer include:
- Performance lower than baseline – The most common reasons for slow or poor performance include overloaded or underpowered servers, unsuitable switch or router configurations, traffic congestion on a low-capacity link, and chronic frame loss.
- Loss of connectivity – If a cable or device fails; the most obvious symptom is a loss of connectivity between the devices that communicate over that link or with the failed device or interface. This is indicated by a simple ping test. Intermittent loss of connectivity can indicate a loose or oxidized connection.
- Network bottlenecks or congestion – If a router, interface, or cable fails, routing protocols may redirect traffic to other routes that are not designed to carry the extra capacity. This can result in congestion or bottlenecks in those parts of the network.
- High CPU utilization rates – High CPU utilization rates are a symptom that a device, such as a router, switch, or server, is operating at or exceeding its design limits. If not addressed quickly, CPU overloading can cause a device to shut down or fail.
- Console error messages – Error messages reported on the device console indicate a physical layer problem.
Issues that commonly cause network problems at the physical layer include:
- Power-related – Power-related issues are the most fundamental reason for network failure. Also, check the operation of the fans, and ensure that the chassis intake and exhaust vents are clear. If other nearby units have also powered down, suspect a power failure at the main power supply.
- Hardware faults – Faulty network interface cards (NICs) can be the cause of network transmission errors due to late collisions, short frames, and jabber. Jabber is often defined as the condition in which a network device continually transmits random, meaningless data onto the network. Other likely causes of jabber are faulty or corrupt NIC driver files, bad cabling, or grounding problems.
- Cabling faults – Many problems can be corrected by simply reseating cables that have become partially disconnected. When performing a physical inspection, look for damaged cables, improper cable types, and poorly crimped RJ-45s. Suspect cables should be tested or exchanged with a known functioning cable.
- Attenuation – Attenuation can be caused if a cable length exceeds the design limit for the media, or when there is a poor connection resulting from a loose cable or dirty or oxidized contacts. If attenuation is severe, the receiving device cannot always successfully distinguish the component bits of the stream from each other.
- Noise – Local electromagnetic interference (EMI) is commonly known as noise. Noise can be generated by many sources, such as FM radio stations, police radio, building security, and avionics for automated landing, crosstalk (noise induced by other cables in the same pathway or adjacent cables), nearby electric cables, devices with large electric motors, or anything that includes a transmitter more powerful than a cell phone.
- Interface configuration errors – Many things can be misconfigured on an interface to cause it to go down, such as incorrect clock rate, incorrect clock source, and interface not being turned on. This causes a loss of connectivity with attached network segments.
- Exceeding design limits – A component may be operating suboptimally at the physical layer because it is being utilized at a higher average rate than it is configured to operate. When troubleshooting this type of problem, it becomes evident that resources for the device are operating at or near the maximum capacity and there is an increase in the number of interface errors.
- CPU overload – Symptoms include processes with high CPU utilization percentages, input queue drops, slow performance, router services such as Telnet and ping are slow or fail to respond, or there are no routing updates. One of the causes of CPU overload in a router is high traffic. If some interfaces are regularly overloaded with traffic, consider redesigning the traffic flow in the network or upgrading the hardware.
Datalink layer
Troubleshooting Layer 2 problems can be a challenging process. The configuration and operation of these protocols are critical to creating a functional, well-tuned network. Layer 2 problems cause specific symptoms that, when recognized, will help identify the problem quickly.
Common symptoms of network problems at the data link layer include:
- No functionality or connectivity at the network layer or above – Some Layer 2 problems can stop the exchange of frames across a link, while others only cause network performance to degrade.
- Network is operating below baseline performance levels – There are two distinct types of suboptimal Layer 2 operation that can occur in a network. First, the frames take a suboptimal path to their destination but do arrive. In this case, the network might experience high-bandwidth usage on links that should not have that level of traffic. Second, some frames are dropped. These problems can be identified through error counter statistics and console error messages that appear on the switch or router. In an Ethernet environment, an extended or continuous ping also reveals if frames are being dropped.
- Excessive broadcasts – Operating systems use broadcasts and multicasts extensively to discover network services and other hosts. Generally, excessive broadcasts result from one of the following situations: poorly programmed or configured applications, large Layer 2 broadcast domains, or underlying network problems, such as STP loops or route flapping.
- Console messages – In some instances, a router recognizes that a Layer 2 problem has occurred and sends alert messages to the console. Typically, a router does this when it detects a problem with interpreting incoming frames (encapsulation or framing problems) or when keepalives are expected but do not arrive. The most common console message that indicates a Layer 2 problem is a line protocol down message.
Issues at the data link layer that commonly result in network connectivity or performance problems include:
- Encapsulation errors – An encapsulation error occurs because the bits placed in a particular field by the sender are not what the receiver expects to see. This condition occurs when the encapsulation at one end of a WAN link is configured differently from the encapsulation used at the other end.
- Address mapping errors – In topologies, such as point-to-multipoint, Frame Relay, or broadcast Ethernet, it is essential that an appropriate Layer 2 destination address be given to the frame. This ensures its arrival at the correct destination. To achieve this, the network device must match a destination Layer 3 address with the correct Layer 2 address using either static or dynamic maps. In a dynamic environment, the mapping of Layer 2 and Layer 3 information can fail because devices may have been specifically configured not to respond to ARP or Inverse-ARP requests, the Layer 2 or Layer 3 information that is cached may have physically changed, or invalid ARP replies are received because of a misconfiguration or a security attack.
- Framing errors – Frames usually work in groups of 8-bit bytes. A framing error occurs when a frame does not end on an 8-bit byte boundary. When this happens, the receiver may have problems determining where one frame ends and another frame starts. Too many invalid frames may prevent valid keepalives from being exchanged. Framing errors can be caused by a noisy serial line, an improperly designed cable (too long or not properly shielded), or an incorrectly configured channel service unit (CSU) line clock.
- STP failures or loops – The purpose of the Spanning Tree Protocol (STP) is to resolve a redundant physical topology into a tree-like topology by blocking redundant ports. Most STP problems are related to forwarding loops that occur when no ports in a redundant topology are blocked and traffic is forwarded in circles indefinitely, excessive flooding because of a high rate of STP topology changes. A topology change should be a rare event in a well-configured network. When a link between two switches goes up or down, there is eventually a topology change when the STP state of the port is changing to or from forwarding. However, when a port is flapping (oscillating between up and down states), this causes repetitive topology changes and flooding, or slow STP convergence or re-convergence. This can be caused by a mismatch between the real and documented topology, a configuration error, such as an inconsistent configuration of STP timers, an overloaded switch CPU during convergence, or a software defect.
Network layer troubleshooting
Network layer problems include any problem that involves a Layer 3 protocol, both routed protocols (such as IPv4 or IPv6) and routing protocols (such as EIGRP, OSPF, etc.).
Common symptoms of network problems at the network layer include:
- Network failure – Network failure is when the network is nearly or completely non-functional, affecting all users and applications on the network. These failures are usually noticed quickly by users and network administrators, and are obviously critical to the productivity of a company.
- Suboptimal performance – Network optimization problems usually involve a subset of users, applications, destinations, or a particular type of traffic. Optimization issues can be difficult to detect and even harder to isolate and diagnose. This is because they usually involve multiple layers, or even the host computer itself. Determining that the problem is a network layer problem can take time.
In most networks, static routes are used in combination with dynamic routing protocols. Improper configuration of static routes can lead to less than optimal routing. In some cases, improperly configured static routes can create routing loops which make parts of the network unreachable.
Troubleshooting dynamic routing protocols requires a thorough understanding of how the specific routing protocol functions. Some problems are common to all routing protocols, while other problems are particular to the individual routing protocol.
There is no single template for solving Layer 3 problems. Routing problems are solved with a methodical process, using a series of commands to isolate and diagnose the problem.
Here are some areas to explore when diagnosing a possible problem involving routing protocols:
- General network issues – Often a change in the topology, such as a down link, may have effects on other areas of the network that might not be obvious at the time. This may include the installation of new routes, static or dynamic, or removal of other routes. Determine whether anything in the network has recently changed, and if there is anyone currently working on the network infrastructure.
- Connectivity issues – Check for any equipment and connectivity problems, including power problems such as outages and environmental problems (for example, overheating). Also check for Layer 1 problems, such as cabling problems, bad ports, and ISP problems.
- Neighbor issues – If the routing protocol establishes an adjacency with a neighbor, check to see if there are any problems with the routers forming neighbor adjacencies.
- Topology database – If the routing protocol uses a topology table or database, check the table for anything unexpected, such as missing entries or unexpected entries.
- Routing table – Check the routing table for anything unexpected, such as missing routes or unexpected routes. Use debug commands to view routing updates and routing table maintenance.
Troubleshooting Transport Layer – ACL
Network problems can arise from transport layer problems on the router, particularly at the edge of the network where traffic is examined and modified. Two of the most commonly implemented transport layer technologies are access control lists (ACLs) and Network Address Translation (NAT).
The most common issues with ACLs are caused by improper configuration. Problems with ACLs may cause otherwise working systems to fail. There are several areas where misconfigurations commonly occur:
- Selection of traffic flow – The most common router misconfiguration is applying the ACL to incorrect traffic. Traffic is defined by both the router interface through which the traffic is traveling and the direction in which this traffic is traveling. An ACL must be applied to the correct interface, and the correct traffic direction must be selected to function properly.
- Order of access control entries – The entries in an ACL should be from specific to general. Although an ACL may have an entry to specifically permit a particular traffic flow, packets never match that entry if they are being denied by another entry earlier in the list. If the router is running both ACLs and NAT, the order in which each of these technologies is applied to a traffic flow is important. Inbound traffic is processed by the inbound ACL before being processed by outside-to-inside NAT. Outbound traffic is processed by the outbound ACL after being processed by inside-to-outside NAT.
- Implicit deny all – When high security is not required on the ACL, this implicit access control element can be the cause of an ACL misconfiguration.
- Addresses and IPv4 wildcard masks – Complex IPv4 wildcard masks provide significant improvements in efficiency, but are more subject to configuration errors. An example of a complex wildcard mask is using the IPv4 address 10.0.32.0 and wildcard mask 0.0.32.15 to select the first 15 host addresses in either the 10.0.0.0 network or the 10.0.32.0 network.
- Selection of transport layer protocol – When configuring ACLs, it is important that only the correct transport layer protocols be specified. Many network administrators, when unsure whether a particular traffic flow uses a TCP port or a UDP port, configure both. Specifying both opens a hole through the firewall, possibly giving intruders an avenue into the network. It also introduces an extra element into the ACL, so the ACL takes longer to process, introducing more latency into network communications.
- Source and destination ports – Properly controlling the traffic between two hosts requires symmetric access control elements for inbound and outbound ACLs. Address and port information for traffic generated by a replying host is the mirror image of address and port information for traffic generated by the initiating host.
- Use of the established keyword– The established keyword increases the security provided by an ACL. However, if the keyword is applied incorrectly, unexpected results may occur.
- Uncommon protocols – Misconfigured ACLs often cause problems for protocols other than TCP and UDP. Uncommon protocols that are gaining popularity are VPN and encryption protocols.
The log keyword is a useful command for viewing ACL operation on ACL entries. This keyword instructs the router to place an entry in the system log whenever that entry condition is matched. The logged event includes details of the packet that matched the ACL element. The log keyword is especially useful for troubleshooting and also provides information on intrusion attempts being blocked by the ACL.
Transport layer – NAT
There are a number of problems with NAT such as not interacting with services like DHCP and tunneling. These can include misconfigured NAT inside, NAT outside, or ACL. Other issues include interoperability with other network technologies, especially those that contain or derive information from host network addressing in the packet. Some of these technologies include:
- BOOTP and DHCP – Both protocols manage the automatic assignment of IPv4 addresses to clients. Recall that the first packet that a new client sends is a DHCP-Request broadcast IPv4 packet. The DHCP-Request packet has a source IPv4 address of 0.0.0.0. Because NAT requires both a valid destination and source IPv4 address, BOOTP and DHCP can have difficulty operating over a router running either static or dynamic NAT. Configuring the IPv4 helper feature can help solve this problem.
- DNS and WINS – Because a router running dynamic NAT is changing the relationship between inside and outside addresses regularly as table entries expire and are recreated, a DNS or WINS server outside the NAT router does not have an accurate representation of the network inside the router. Configuring the IPv4 helper feature can help solve this problem.
- SNMP – Similar to DNS packets, NAT is unable to alter the addressing information stored in the data payload of the packet. Because of this, an SNMP management station on one side of a NAT router may not be able to contact SNMP agents on the other side of the NAT router. Configuring the IPv4 helper feature can help solve this problem.
- Tunneling and encryption protocols – Encryption and tunneling protocols often require that traffic be sourced from a specific UDP or TCP port, or use a protocol at the transport layer that cannot be processed by NAT. For example, IPsec tunneling protocols and generic routing encapsulation protocols used by VPN implementations cannot be processed by NAT.
Note: DHCPv6 from an IPv6 client can be forwarded by the router using the ipv6 dhcp relay command.
Application Layer
Most of the application layer protocols provide user services. Application layer protocols are typically used for network management, file transfer, distributed file services, terminal emulation, and email. New user services are often added, such as VPNs and VoIP.
The figure shows the most widely known and implemented TCP/IP application layer protocols include:
- SSH/Telnet – Enables users to establish terminal session connections with remote hosts.
- HTTP – Supports the exchanging of text, graphic images, sound, video, and other multimedia files on the web.
- FTP – Performs interactive file transfers between hosts.
- TFTP – Performs basic interactive file transfers typically between hosts and networking devices.
- SMTP – Supports basic message delivery services.
- POP – Connects to mail servers and downloads email.
- Simple Network Management Protocol (SNMP) – Collects management information from network devices.
- DNS – Maps IP addresses to the names assigned to network devices.
- Network File System (NFS) – Enables computers to mount drives on remote hosts and operate them as if they were local drives. Originally developed by Sun Microsystems, it combines with two other application layer protocols, external data representation (XDR) and remote-procedure call (RPC), to allow transparent access to remote network resources.
The types of symptoms and causes depend upon the actual application itself.
Application layer problems prevent services from being provided to application programs. A problem at the application layer can result in unreachable or unusable resources when the physical, data link, network, and transport layers are functional. It is possible to have full network connectivity, but the application simply cannot provide data.
Another type of problem at the application layer occurs when the physical, data link, network, and transport layers are functional, but the data transfer and requests for network services from a single network service or application do not meet the normal expectations of a user.
A problem at the application layer may cause users to complain that the network or the particular application that they are working with is sluggish or slower than usual when transferring data or requesting network services.
Troubleshooting IP connectivity
Example: 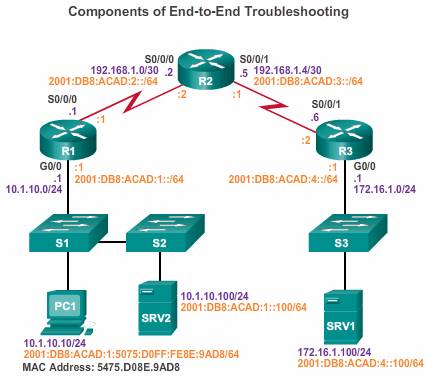
Throughout this topic, the following scenario is used. The client host PC1 is unable to access applications on Server SRV1 or Server SRV2. The figure shows the topology of this network. PC1 uses SLAAC with EUI-64 to create its IPv6 global unicast address. EUI-64 creates the Interface ID using the Ethernet MAC address, inserting FFFE in the middle, and flipping the seventh bit.
When there is no end-to-end connectivity, and the administrator chooses to troubleshoot with a bottom-up approach, these are common steps the administrator can take:
Step 1. Check physical connectivity at the point where network communication stops. This includes cables and hardware. The problem might be with a faulty cable or interface, or involve misconfigured or faulty hardware.
All network devices are specialized computer systems. At a minimum, these devices consist of a CPU, RAM, and storage space, allowing the device to boot and run the operating system and interfaces. This allows for the reception and transmission of network traffic. When a network administrator determines that a problem exists on a given device, and that problem might be hardware-related, it is worthwhile to verify the operation of these generic components. The most commonly used Cisco IOS commands for this purpose are show processes cpu, show memory, and show interfaces. This topic discusses the show interfaces command.
When troubleshooting performance-related issues and hardware is suspected to be at fault, the show interfaces command can be used to verify the interfaces through which the traffic passes.
The output of the show interfaces command in the figure lists a number of important statistics that can be checked:
- Input queue drops – Input queue drops (and the related ignored and throttle counters) signify that at some point, more traffic was delivered to the router than it could process. This does not necessarily indicate a problem. That could be normal during traffic peaks. However, it could be an indication that the CPU cannot process packets in time, so if this number is consistently high, it is worth trying to spot at which moments these counters are increasing and how this relates to CPU usage.
- Output queue drops – Output queue drops indicate that packets were dropped due to congestion on the interface. Seeing output drops is normal for any point where the aggregate input traffic is higher than the output traffic. During traffic peaks, packets are dropped if traffic is delivered to the interface faster than it can be sent out. However, even if this is considered normal behavior, it leads to packet drops and queuing delays, so applications that are sensitive to those, such as VoIP, might suffer from performance issues. Consistently seeing output drops can be an indicator that you need to implement an advanced queuing mechanism to provide good QoS to each application.
- Input errors – Input errors indicate errors that are experienced during the reception of the frame, such as CRC errors. High numbers of CRC errors could indicate cabling problems, interface hardware problems, or, in an Ethernet-based network, duplex mismatches.
- Output errors – Output errors indicate errors, such as collisions, during the transmission of a frame. In most Ethernet-based networks today, full-duplex transmission is the norm, and half-duplex transmission is the exception. In full-duplex transmission, operation collisions cannot occur; therefore, collisions and especially late collisions often indicate duplex mismatches.
Step 2. Check for duplex mismatches.
Another common cause for interface errors is a mismatched duplex mode between two ends of an Ethernet link. In many Ethernet-based networks, point-to-point connections are now the norm, and the use of hubs and the associated half-duplex operation is becoming less common. This means that most Ethernet links today operate in full-duplex mode, and while collisions were seen as normal for an Ethernet link, collisions today often indicate that duplex negotiation has failed, and the link is not operating in the correct duplex mode.
The IEEE 802.3ab Gigabit Ethernet standard mandates the use of autonegotiation for speed and duplex. In addition, although it is not strictly mandatory, practically all Fast Ethernet NICs also use autonegotiation by default. The use of autonegotiation for speed and duplex is the current recommended practice.
Duplex configuration guideline:
- Point-to-point ethernet link should always run in full-duplex
- Half duplex is not common now, unless hub is used.
- Auto-negotiated speed and duplex mode is recommended
- If auto-negotiation is now working, configure on both ends
- Half duplex on both ends works better than mismatch
Step 3. Check data link and network layer addressing on the local network. This includes IPv4 ARP tables, IPv6 neighbor tables, MAC address tables, and VLAN assignments.
Step 4. Verify that the default gateway is correct.
Step 5. Ensure that devices are determining the correct path from the source to the destination. Manipulate the routing information if necessary.
Step 6. Verify the transport layer is functioning properly. Telnet can also be used to test transport layer connections from the command line.
Step 7. Verify that there are no ACLs blocking traffic.
Step 8. Ensure that DNS settings are correct. There should be a DNS server that is accessible.
Best practice
1. check the connection status.
1. Physical connection
2. check the speed
3. check the mode
4. check the driver