Expert system
The red button on the left bottom corner.
Expert Information is classified into one of four categories:
Errors: Packet or dissector errors
Warnings: Unusual responses from the application/transport
- TCP zero window
- TCP window full
Notes: Unusual responses from the application/transport (may be a recovery process from a Warning)
Chats: Information about the workflow
Packet Comments:
If you click the red button, then click the related packet in the severity level(Error, Warn), the other window will show the packet in packet list.
Use display filter to show the packet according to the severity level.
Click Expressions… > in Field Name, find Expert – Expert info > click == in relation > choose the one you need from Value
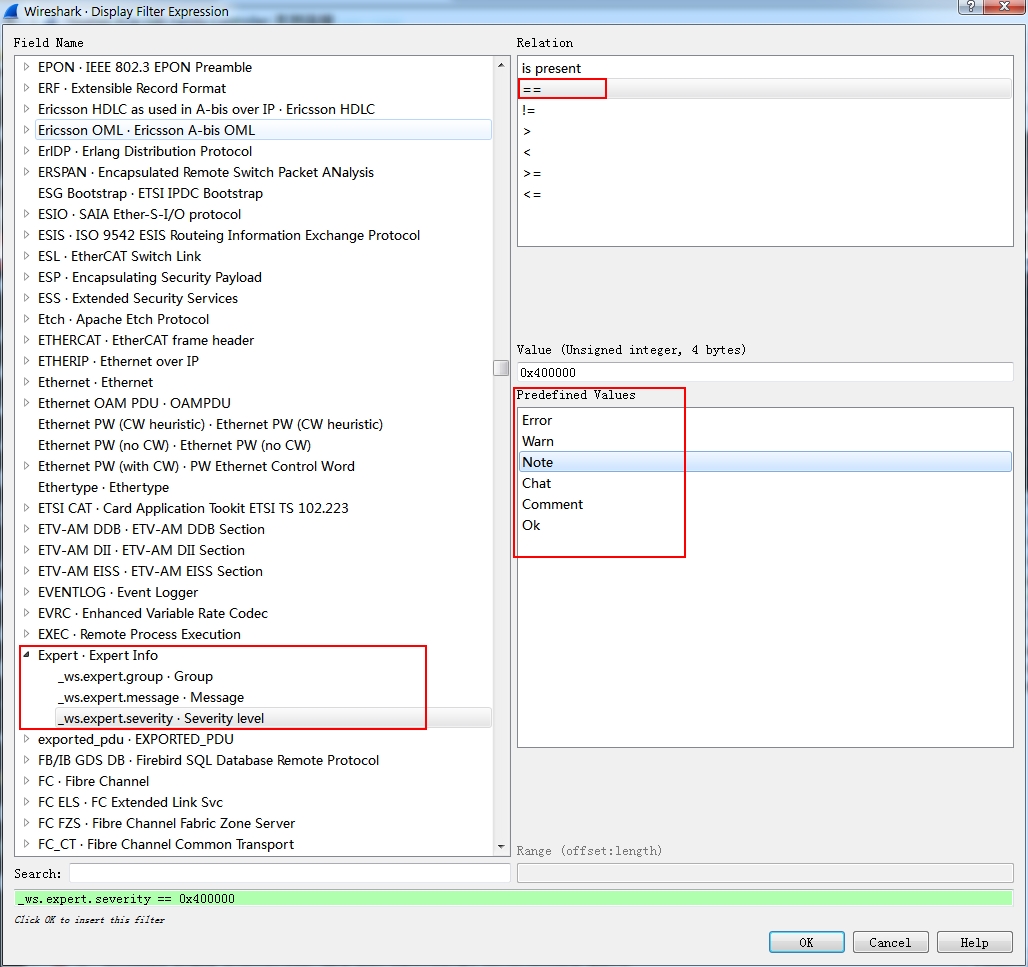
or use expression:
_ws.expert.severity == value
value can be:
“Error”: 0x800000
“Warn” : 0x600000
“Note”: 0x400000
“Chat”: 0x200000
“Comment”: 0x100000
“Ok”: 0x1
TCP/IP analysis
- To show the real sequence number instead of relative sequence number, Click Preferences > Protocols > TCP > uncheck the “Relative sequence numbers”
Follow one flow or conversation:
There are several ways to track one conversation:
- Click statistics > Conversations > click tab TCP . Here, you can choose the right conversation by pairing addresses in column Address A and Address B.
Click the target line, then you can click Follow stream, or click graph to analyse the conversation.
- You can also get there by Statistics > TCP Stream Graph > Time-sequence Graph(TCPtrace).
- If you know the relative sequence number, you can type “tcp.stream eq number” in the display filter.
- If you see one piece of conversation packet in the packets list and you want to show the whole conversation, right click the packet > Conversation filter > TCP . You can check the display filter, basically it add the expression “ip.addr eq xxx.xxx.xxx.xxx and ip.addr eq xxx.xxx.xxx.xxx”
Start from syn and end with Fin
We know that the TCP traffic start from TCP 3-way hand shakes, which starts from send a packet with syn flag. So we can search packets in the Wireshark with syn flag to track a TCP traffic.
Type tcp.flags.syn==1 in the display filter, you can use tcp.flags.fin==1 to filter the packets with fin flag.
You can check this in the packet list, Transmission Control Protocol > Flags > syn: set value
Troubleshooting: see three tcp syn but no acknowledgement, it would be the problem of the other side is down.
Window size:
Definition: How much data can I send without receiving acknowledgement from the other side.
The amount of data the sender can send is more complicated. The upper bound is the receiver’s advertised window, the sender can’t send more than that or data will be discarded. Here are some factors to consider:
- The amount of unacknowledged data already sent i.e. bytes in flight
Bytes in Flight: Bytes in flight is the amount of data that has been sent but not yet acknowledged. If the receiver’s window is 64k and we’ve sent 48k that hasn’t yet been acknowledged, then we can only send 16k more before we fill the receive window. Once we receive an ACK with an updated Window Size, we can send more data. - The congestion window (cwnd)
- The send buffer size (SO_SNDBUF)
Selective Ack
Regular Ack
Preferences > protocols > TCP > make sure you checked “Track number of bytes in flight”.
If we look at the IO graph, which shows the amount of data has been sent.
To check out the number of bytes in flight, you can type “tcp.analysis.bytes_in_flight”in the display filter.
You can check the number of bytes in the packet info window, Transmission Control Protocol, Src … > SEQ/ACK analysis > [Bytes in flight]
Push
PUSH flag means the urgent packet.
Both the client and server has buffer area, if you send some data with PUSH flag, it will send it straight away without buffing the data.
Reset
usually done by firewall.
Graph:
TCP time sequence graph:
Filter out TCP on display filter, choose one packet which belongs to the conversation you want to analysis , then Go statistics > TCP Stream Graph > Time sequence graph.
Window Scaling graph:
- A consistent window size means good network traffic.
- If it changes constantly, something between two host is dropping packet.
- A download boosting software If the window size go up fast and keep at the same level
Round Trip time Graph:
Understanding RTT Impact on TCP Retransmissions
Ever get asked to explain or elaborate on something that you should definitely know, only to realize that you don’t fully understand it yourself? You’re certainly not alone.
Even though the basics of Transmission Control Protocol (TCP) connections are one of the very first topics covered when learning about computer network fundamentals, many of us are perplexed by retransmission logic and still have no idea what Smoothed Round Trip Time (SRTT) means. But fear not; we’re here to shed some light on them for all levels of speed gurus.
First, we start with Round Trip Time, or RTT. For Ping and Traceroute, this measures the round trip time between sending the Ping packet and getting the ICMP packet back. For TCP connections it is quite similar; it measures the time sending a packet to getting the acknowledgment packet from the target host.
Let’s say you have host A and host B. The TCP Three-Way Handshake is as follows:

- Computer A sends a TCP SYN packet to computer B (This is where RTT timer begins)
- Computer B sends a TCP SYN-ACK packet to computer A (This is where RTT timer ends)
- Computer A then sends a TCP ACK packet to computer B (The TCP connection is now established!)
If you are relying on Wireshark to capture and analyze packets, the tool will calculate and display the RTT on the packet containing the ACK. See the last line in the figure below:
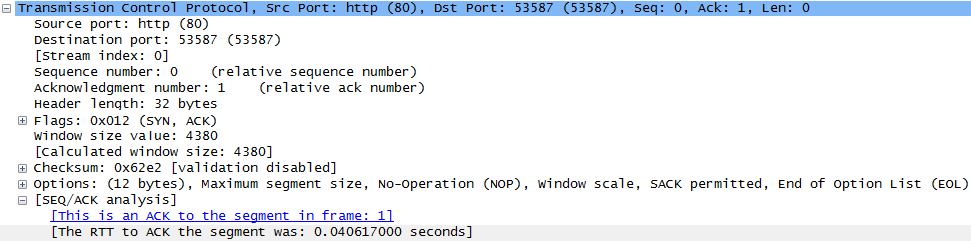
Easy to understand, right? But what happens when a packet is lost? TCP protocol has built-in logic for ensuring that packets are received. Thus, to ensure the packet is received, the sender will retransmit the packet to the other party.
The majority of us are well aware of the primary retransmission logic. On the initial packet sequence, there is a timer called Retransmission Timeout (RTO) that has an initial value of three seconds. After each retransmission the value of the RTO is doubled and the computer will retry up to three times. This means that if the sender does not receive the acknowledgement after three seconds (or RTT > 3 seconds), it will resend the packet. At this point the sender will wait for six seconds to get the acknowledgement. If the sender still does not get the acknowledgement, it will retransmit the packet for a third time and wait for 12 seconds, at which point it will give up.
While this is the most well-known fact of RTO, it is not the only logic in TCP. The TCP protocol was designed to take in consideration that the connection between two computers is not the same – hence the retransmission logic should be quicker for cases where the two computers are close. This where RTT starts impacting RTO.
While this is the most well-known fact of RTO, it is not the only logic in TCP. The TCP protocol was designed to take in consideration that the connection between two computers is not the same – hence the retransmission logic should be quicker for cases where the two computers are close. This where RTT starts impacting RTO.
When the TCP connection is established, there is one RTT value, and the RTO will be adjusted based on the Smoothed RTT (SRTT) calculation. The calculation applies a smoothing factor to the RTT which creates a predicted round-trip time that is beneficial to the assurance of packet delivery. SRTT formula is:
SRTT(ALPHA * SRTT) + ((1-ALPHA) * RTT)

ALPHA = smoothing factor between .8 and .9
RTT = Round Trip Time
Once the SRTT is calculated, it is used as a determining factor of how long the host will wait before retransmitting the segment, which is calculated as RTO below:
RTO = min[UBOUND, max[LBOUND(BETA * SRTT)]]

UBOUND = upper bound on the timeout (e.g. 1 minute)
LBOUND = lower bound on the timeout (e.g. 1 second)
BETA = delay variance factor (e.g. 1.3-2.0)
If no response packet is received after sending the segment, then the RTO is doubled after each re-transmission and the previous re-transmission is ignored in the RTT calculation. This strategy is known as Karn’s Algorithm and is considered to be highly effective, especially in areas with high packet latency.