Basic
What is wireshark capturing
By default, wireshark only monitor the traffic originated from or to local interface.
If you want to monitor the whole network, you have to configure the port mirroring on the switch: configure the default gateway interface as the mirrored port and the interface connected to your PC as the mirroring port.
First capture packets, click capture > option > type a filter by hand or click the green bookmark icon to use predefined filters > then click start.
Mark the useful packet ,Ignore, or comment:
- click a single line, ctr+M (cmd+M in Mac)
- Ignore packets: ctr+d
- Switch between the marked packets:
shift+ctr+n or b
- Comment Packet: right click a important packet, click Packet comment…. Then type the comment.
- Show the packets with comment:in display filter area, type “pkt_comment”, press enter, all the packets with comment will show.
Color code:
Light blue: udp
Light purple: tcp
…
To customise the color: Go to view > colouring rules
Preferences:
CFilters: capture filter
DFilters:display filter
Colorfilters
Services: translate port number to protocol name
click capture>options>option tab, resolve transport names
Hosts file: network names – DNS
click capture>options>option tab, resolve network names
Resolve MAC addresses: tell the device manufacture name, like apple device, sumsong, etc.
Maximum recent file
preferences: 10 recent files by default.
Column:
Customize the columns according to your need.
In preferences window, click columns > click + > name it, double click Type field > choose the type of info you want. E.g. UTC time.
filter (capture filter, display filter)
1. Comparison
Comparison operator:
==
! =
<
<=
>
>=
| English | C-like | Description and example |
|---|---|---|
| and | && | Logical AND. ip.src==10.0.0.5 and tcp.flags.fin |
| or | || | Logical OR. ip.scr==10.0.0.5 or ip.src==192.1.1.1 |
| xor | ^^ | Logical XOR. tr.dst[0:3] == 0.6.29 xor tr.src[0:3] == 0.6.29 |
| not | ! | Logical NOT. not llc |
| […] | one of them | |
| in |
tcp.port in {80 443 8080}
|
|
| Ne or != | Not equal ip.addr != 192.168.1.110 |
|
| contains | contains specified value http contains “https://www.abc.com” |
2. Protocol filter: enter the protocol name .
Now let’s see an example:
In your company network ,you doubt that there are IP duplication. Use the arp.duplicate-address-frame Wireshark filter to display only duplicate IP information frames.These filters have been used to indicate ARP cache poisoning.
The capture result contains following info:
- Usually duplicate IP addresses are resolved by the DHCP server. It has to be taken seriously when it starts showing for every IP address in this case.
- All IPs have the same Sender MAC address and shows as a duplicate of that IP address.
- This could be ARP poisoning—a Man in Middle attack happening in the background.
Notice that the selected filter tcp.flags == 0x12 will sort out packets with only TCP SYN ACK packets. The best part about filters is that Wireshark works with you to help you construct valid filters.
If a filter is not valid, the filter field turns red. Green filters are valid.
3. IP filter:
- host 10.1.1.1
- host google.com
-
Match destination:
ip.dst == x.x.x.xMatch source:
ip.src == x.x.x.xMatch either:
ip.addr == x.x.x.x - match network address:
ip.addr== x.x.x.x/x
4.Conversation filter
You may want to inspect the entire conversation between these two hosts.
To create a conversation filter, right-click the packet, select Conversation Filter, and then select IPv4. All traffic between the hosts is now filtered. Once applied, the filter is also displayed in the filter field.
example of a conversation filter: ip.addr eq 192.168.1.101 and ip.addr eq 192.168.1.123
You can actually manually craft such a filter if you read through the filter.
5. multiple filter
you can use () to group different filter together.
E.g. your network is 192.168.0.0/24, you don’t want to show arp or broadcast traffic:
(not ip.addr== 192.168.0.255)&&(not arp)
Note. there is no space between the operator and ().
6. The predefined capture filter
Click help > About wireshark >choose folders tab> click the line after Program , then find the file cfilters . Open it with text editor.
Then you can add a capture filter, here:
"name" filter_entries
- name is the name you want to use, you can use any name to remind you for later use.
- filter_entries are the filter you want to define.
Display filter
To analyse the http traffic, Start from DNS, this will show you how many websites have been open. Note that, some of them are manually visited, some are like pop-up window, page content redirecting.
dns.resp.name : show the response from the DNS server.
Add common used filter as button:

1. type the expression in the display filter area.
2. Click the + button, then name it in the Label area, here I enter the “http.404”. click OK
3. The result is you will get a new button. so you can click the button next time to apply this display filter.
![]()
keywords in the info column
To find the packet contains keywords in the info column, use Ctr-f(windows) or command-f(MAC), then choose string in the area and type the keyword you want to search.
Statistics
Useful info:
- Resolved addresses: show all the IP address to DNS name mapping in the captured packets.
- Endpoints: check the statistics for every interface, ip version, TCP, UDP
- Conversation: show the conversation between to IP(host)
- Packet length: show the percentage of difference size packets in all the traffic.
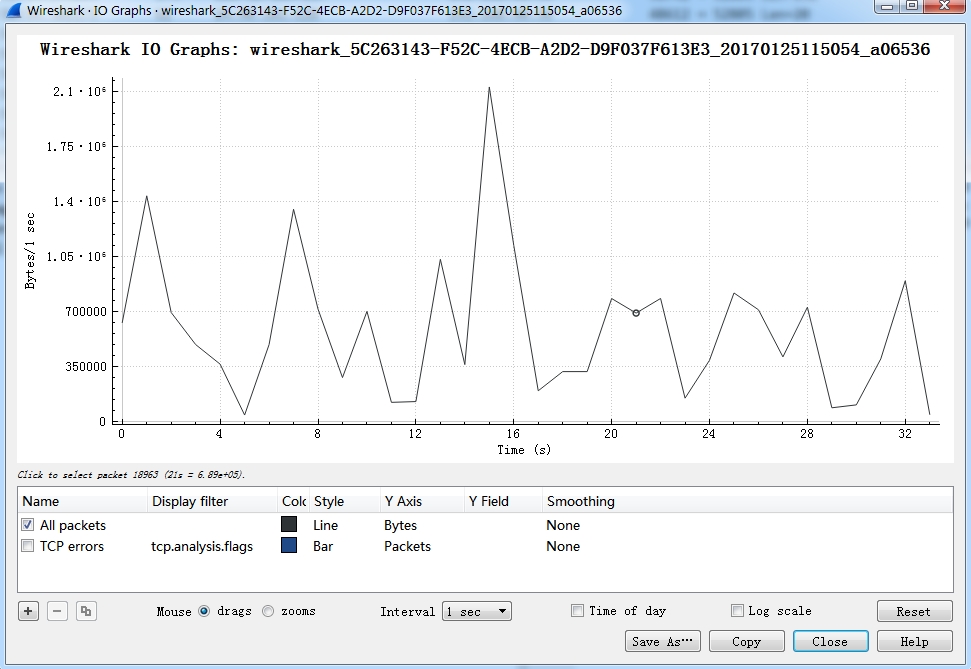
- I/O Graph: can be used to analysis network activity.
Normal graph: The graph looks like no regular shape, and the minimum speed can almost hit 0 sometimes.
Download graph:
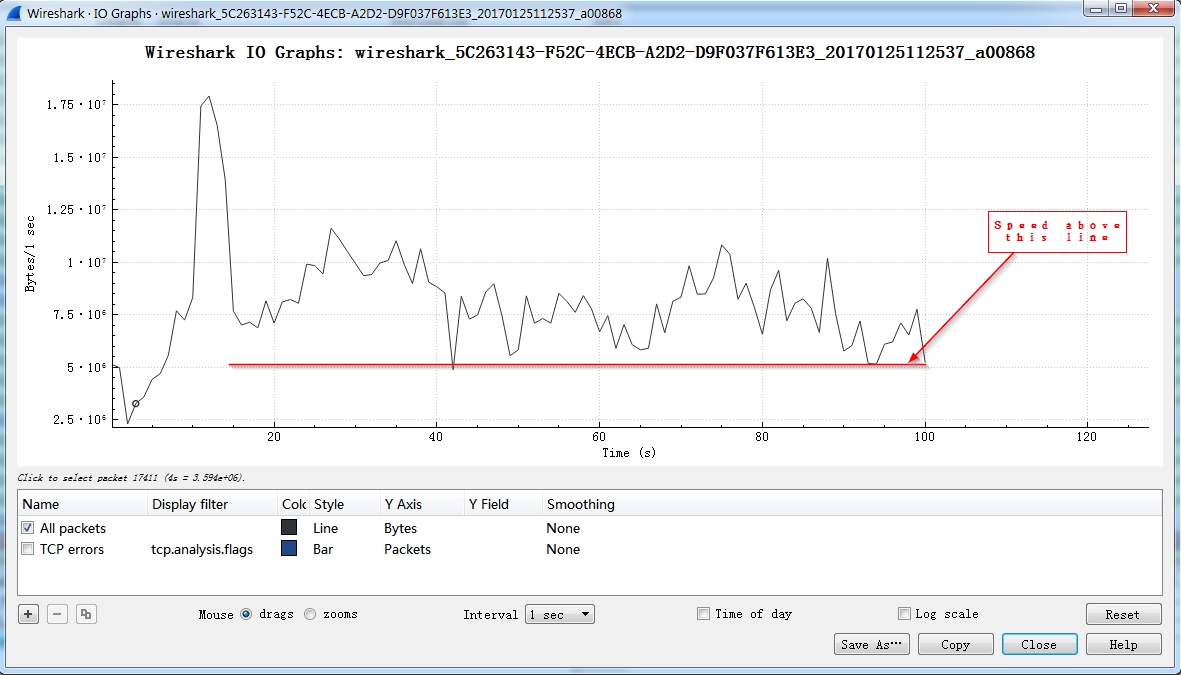 If the speed never drop below a level , it seems like someone is downloading.
 - Flow graph:
Analyse the individual packet:
Source port
Destination port
Sequence number
Acknowledgment number
Flags: ACK,URG, FIN, SYN, RST, PSH
Window Size value:
checksum: used to check if the packet has been modified or damaged.
Follow a TCP stream
in the display filter, type “tcp”. then choose a stream according to the IP address or protocol name, right click the entry > Follow > TCP stream.
Related turtorial
ccm_post
IGMPv1 membership report
ISMP( InterSwitch Message Protocol )
https://www.wireshark.org/docs/dfref/i/ismp.html
LLMNR
The Link-Local Multicast Name Resolution (LLMNR) is a protocol based on the Domain Name System (DNS) packet format that allows both IPv4 and IPv6 hosts to perform name resolution for hosts on the same local link. It is included in Windows Vista, Windows Server 2008, Windows 7, Windows 8 and Windows 10.[1] It is also implemented by systemd-resolved on Linux.
[RST,ACK]: If the sending machine is sending data too fast, the receiving machine will send RST to tell the sending machine to slow down.
Simple Service Discovery Protocol (SSDP)
The SSDP protocol can discover Plug & Play devices, with uPnP (Universal Plug and Play). SSDP uses unicast and multicast adress (239.255.255.250). SSDP is HTTP like protocol and work with NOTIFY and M-SEARCH methods.
Management packet:
If 70% of the traffic is management packet, it’s normal.
Reference
build a display filter: https://www.wireshark.org/docs/wsug_html_chunked/ChWorkBuildDisplayFilterSection.html