XLSX writer
Note in the excel, the cell is indexed by a letter and number, like this:
| A1 | B1 | C1 |
| A2 | B2 | C2 |
| A3 | B3 | C3 |
| A… | B… | C… |
In the xlsx we can use the letter and number combo way, Or by two numbers, in this way:
| 0,0 | 0,1 | 0,… |
| 1,0 | 1,1 | 1,… |
| 2,0 | 2,1 | 2,… |
| 3,0 | 3,0 | 3,… |
Syntax:
First of all, we need to import the module:
import xlsxwriter
We can use methods to work on the excel file, but we have to create a file first and pass it to a object:
workbook = xlsxwriter.Workbook('demo1.xlsx')
Then we can use mothod write add content, which can be text, number, formula or picture:
workbook.write(cell_number, content, format)
workbook.insert_image(cell_number, picture_path,format)
#coding:utf-8
 import xlsxwriter
 workbook = xlsxwriter.Workbook('demo1.xlsx')  #create a Excel file named demo1.xlsx and pass it to the object workbook.
 worksheet = workbook.add_worksheet()  #create a workbook
 worksheet.set_column('A:A',20)  #Set the first column's width to 20 pixels
 bold = workbook.add_format({'bold':True}) #create a format object "bold" to set the fold to bold
 worksheet.write('A1','Hello')  #write " hello" into the A1 cell.
 worksheet.write('A2','World',bold)
 worksheet.write('B2',u'Just a test',bold) #Write a bold text in B2 cell
 worksheet.write(2,0,32) #用行列表示法写入数字'32'与'35.5'
 worksheet.write(3,0,35.5) #行列表示法的单元格下标以0作为起始值, '3, 0'等价
 worksheet.write(4,0,'=SUM(A3:A4) ') #求A3: A4的和, 并将结果写入'4, 0',
 worksheet.insert_image('B5','img/python-logo.png') #在B5单元格插入图片
 workbook.close()
chart
Ref: http://xlsxwriter.readthedocs.io/chart.html
#coding: utf-8
import xlsxwriter
workbook = xlsxwriter.Workbook('chart.xlsx') #Create a Excel file
worksheet = workbook.add_worksheet() #create a worksheet object
chart = workbook.add_chart({'type': 'column'}) #create a chart object
#Create the header data
title = [u'Name', u'Mon', u'Tue', u'Wed', u'Thu', u'Fri', u'Sat', u'Sun', u'Ave']
channelname= [u'Business', u'News', u'Shopping', u'Sport', u'Woman'] #Channel name
#Define the speed data
data = [
[150,152,158,149,155,145,148],
[89,88,95,93,98,100,99],
[201,200,198,175,170,198,195],
[75,77,78,78,74,70,79],
[88,85,87,90,93,88,84],
]
format=workbook.add_format() #define the object "format" as a "Format object"
format.set_border(1) #set the border width as 1 pixel
format_title=workbook.add_format() #define the object "format_title" as a "Format object"
format_title.set_border(1)
format_title.set_bg_color('#cccccc') #Set background color
format_title.set_align('center')
format_title.set_bold()
format_ave=workbook.add_format()
format_ave.set_border(1)
format_ave.set_num_format('0.00')
worksheet.write_row('A1', title, format_title)
worksheet.write_column('A2', channelname, format)
worksheet.write_row('B2', data[0], format)
worksheet.write_row('B3', data[1], format)
worksheet.write_row('B4', data[2], format)
worksheet.write_row('B5', data[3], format)
worksheet.write_row('B6', data[4], format)
#Define the function for the data
def chart_series(cur_row) :
worksheet.write_formula('I'+cur_row, \
'=AVERAGE(B'+cur_row+': H'+cur_row+') ', format_ave)
chart.add_series({
'categories':'=Sheet1!$B$1:$H$1', #add First row (monday to sunday) as the X axis in the chart,
# $1 means the first row, and so on.
'values':'=Sheet1!$B$'+cur_row+':$H$'+cur_row, #The mandatory part, pass the value of each row to the chart.
'line':{'color': 'black'}, #define the line color as black
'name':'=Sheet1!$A$'+cur_row, #
})
for row in range(2, 7): #use data in row 2 ~ 6 to create the chart
chart_series(str(row) )
#chart.set_table() #Set the x axis
#chart.set_style(30) #??????, ??????
chart.set_size({'width': 577, 'height': 287}) #set the size of the chart
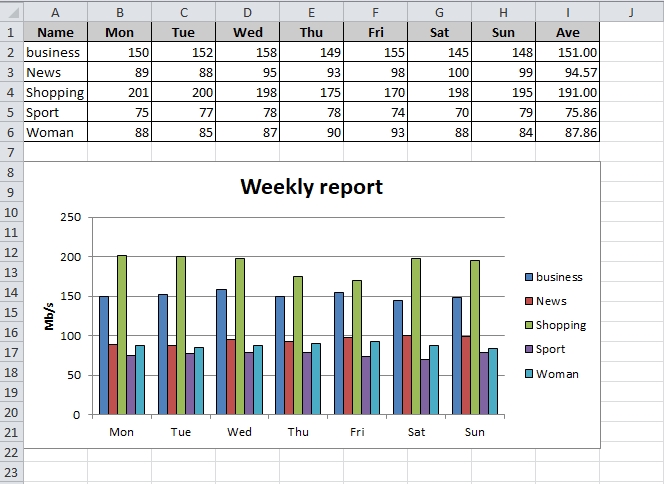
chart.set_title ({'name': u'Weekly report'}) #set the title for the chart
chart.set_y_axis({'name': 'Mb/s'}) #set the y axis title
worksheet.insert_chart('A8', chart) #insert the chart into A8
workbook.close()
The result will be:
Create routing map
First of all we needs to have three apps:
yum -y install tcpdump graphviz ImageMagick
Then install scapy:
pip install scapy
The python code will be like:
#coding:utf-8
import os, sys, time, subprocess
import warnings, logging
warnings.filterwarnings("ignore", category=DeprecationWarning) #block the scapy warnings
logging.getLogger("scapy.runtime") .setLevel(logging.ERROR) #block IPv6 module
from scapy.all import traceroute
domains = raw_input('Please input one or more IP/domain: ') #Ask user to type an IP
target = domains.split(' ')
dport = [80] #the target port
if len(target) >= 1 and target[0]!='':
    res, unans = traceroute(target, dport=dport, retry=-2)
    res.graph(target="> test.svg")
    time.sleep(1)
    subprocess.Popen("/usr/bin/convert test.svg test.png", shell=True) #convert svg to png format

else:
    print "IP/domain number of errors, exit"